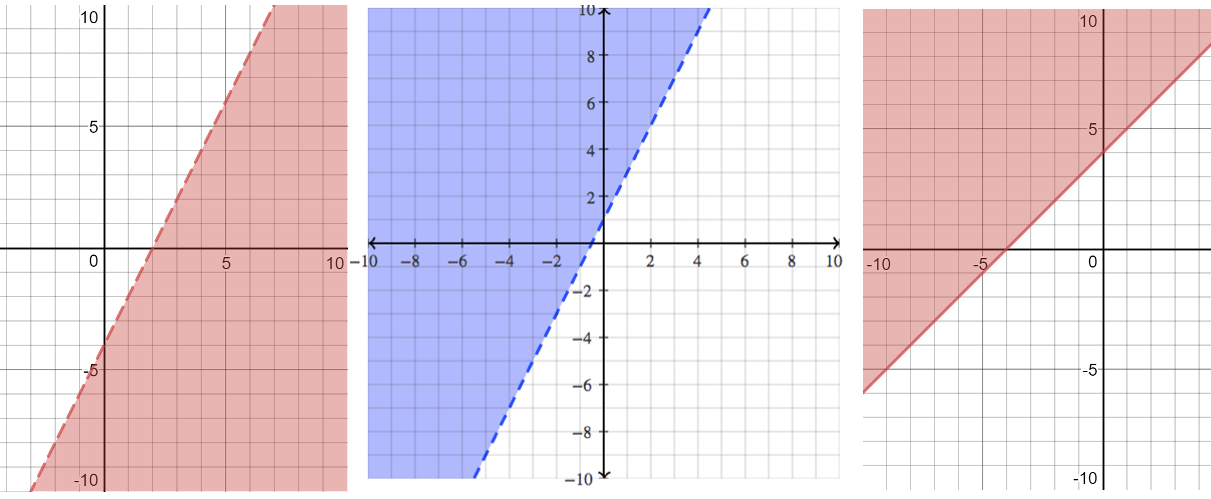
Step into the world of linear inequalities and uncover the mathematical principles that shape our understanding of systems of equations. This quiz will test your ability to analyze, interpret, and solve linear inequalities with precision. Good luck, and may your problem-solving skills shine!
We recommend that you do not leave the page that you are taking this quiz in. Stay honest 🙂
System of Linear Inequalities Quiz Questions Overview
1. What does the solution of a system of linear inequalities represent?
A single point
A line
A region in the plane
An empty set
2. Which of the following is a correct inequality for the half-plane above the line y = 2x + 3?
y < 2x + 3
y > 2x + 3
y ≤ 2x + 3
y ≥ 2x + 3
3. How do you determine if a point is a solution to a system of linear inequalities?
By checking if the point lies on one of the lines
By substituting the point into each inequality
By graphing the point
By calculating the distance from the origin
4. Which of the following systems of inequalities represents the region where x is at least 1 and y is less than 4?
x > 1, y < 4
x ≥ 1, y ≤ 4
x ≥ 1, y < 4
x > 1, y ≤ 4
5. What type of line is used to graph the inequality y ≤ -3x + 2?
A solid line
A dashed line
A dotted line
No line
6. Which inequality represents the region below the line y = -x + 5?
y < -x + 5
y > -x + 5
y ≤ -x + 5
y ≥ -x + 5
7. In a system of linear inequalities, what does the intersection of the solution regions represent?
The union of the solution regions
The difference of the solution regions
The intersection of the solution regions
The area outside the solution regions
8. How is the inequality x + y > 3 represented graphically?
A solid line with shading above
A dashed line with shading above
A solid line with shading below
A dashed line with shading below
9. Which of the following inequalities represents the region to the right of the line x = -2?
x < -2
x > -2
x ≤ -2
x ≥ -2
10. What is the graphical representation of the system of inequalities y ≤ 2x + 1 and y > -x + 3?
The region below y = 2x + 1 and above y = -x + 3
The region above y = 2x + 1 and below y = -x + 3
The region below y = 2x + 1 and below y = -x + 3
The region above y = 2x + 1 and above y = -x + 3
We recommend that you do not leave the page that you are taking this quiz in. Stay honest 🙂
Can Your Friends Do Better Than You in This Quiz?
Share this quiz with your friends and compare results.
Was this page helpful?
More Popular Math Quizzes:
-
Trigonometry Quiz
-
Factoring Quiz
-
Addition Quiz
-
Significant Figures Quiz
-
200 Digits of Pi Quiz
-
100 Digits of Pi Quiz


